Turn observations
into light curves.
Seestar Photometry Analyzer helps you explore stellar brightness, inspect tracking stability, and share your results—from logs or session folders to exploratory charts, entirely in your browser.
For Seestar S50 / S50 Pro exports · No installation or account required
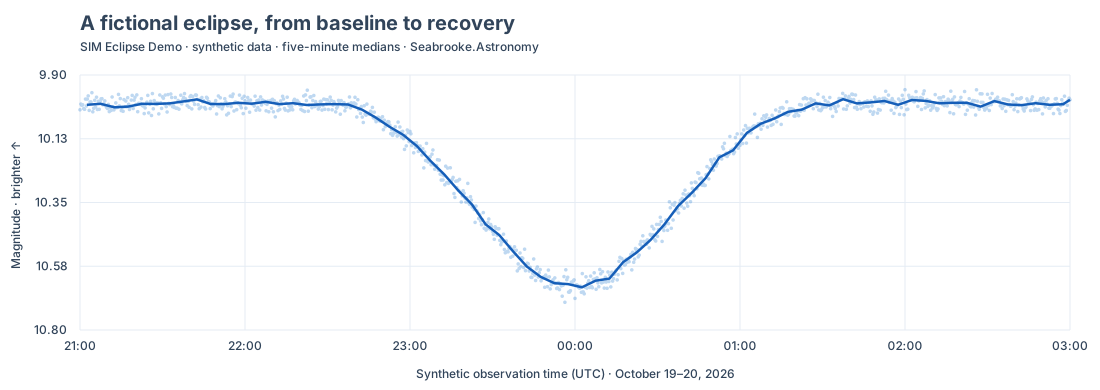
A closer look at your observing session
Interactive photometry
Actual observation times, an inverted magnitude axis, clock-aligned median bins, optional uncertainty bars, and zoom and pan.
Tracking diagnostics
Inspect sensor positions, drift, and possible movement events alongside changes in measured brightness.
Quality controls and themes
Inspect SNR and uncertainty, switch between targets, and choose five coordinated themes, including red light and high contrast.
Session scans and curve gallery
Explore provisional coordinate tracks in selectable-size miniature curves. Check target-log overlap and inspect local catalogue candidates or click through to SIMBAD. Associations and review ranking remain exploratory.
Results you can share
Export a high-resolution chart, processed CSV, or printable HTML report. Exploratory variability shading stays clearly labeled as a heuristic.
Try it with an example
- Download the sample
Get the synthetic eclipse CSV: 1,081 measurements across six hours, including a midnight crossing.
- Open the analyzer
Launch the tool, then select or drag in the downloaded CSV. Your own Seestar files work the same way.
- Inspect and export
Explore the dip, adjust the bins, inspect tracking, and export your chart or report.
Fork it. Adapt it. Share it.
The source is available under the MIT license. Download the self-contained analyzer, adapt it for your observing workflow, or contribute improvements through a pull request.
AI development disclosure
OpenAI Codex generated and revised the code, analysis heuristics, synthetic data generator, tests, and documentation under the direction of Chris Seabrooke / Seabrooke.Astronomy.
Automated tests include real Seestar data and synthetic fixtures. These checks are not independent scientific validation. Variability flags do not confirm eclipses or predict future events.
Read the full disclosure ↗